

Reports
Report Studio
Build, run, export, schedule, share and publish reports on WorkHarmony's own HR data, with every viewer limited to the rows and fields their access allows.
1. Introduction
1.1 What Report Studio is
Report Studio is WorkHarmony's built-in report builder. You design a report once, on WorkHarmony's own HR data, and publish it to the right people. Everyone who opens it sees only the rows and fields their access allows. No database knowledge is needed, and no report ever needs IT to deploy it.
1.2 What you can do with Report Studio
- Build a report in six plain-language steps with the Simple wizard, start from one of 28 ready-made templates, or design a pixel-exact layout in the Advanced designer.
- Run it on live data, with parameters such as period and department, search, sorting, column choice, saved filters, drill-down and comments.
- Present the result as a table, a grouped summary, KPI cards, a bar, line or donut chart, a pivot, a matrix, or one printable page per record.
- Export to Excel, CSV or PDF, and print to any paper size.
- Schedule automatic deliveries to people and roles. Every recipient gets a file built under their own access.
- Share a report with a colleague, but never wider than your own access.
- Publish a report into any module menu, such as Time & Attendance › Reports, after review and approval.
1.3 Five ideas that explain everything else
| Idea | What it means |
|---|---|
| 1. Data source | Every report reads one approved data source. In Daily attendance one row is one employee on one day; in Employee directory one row is one employee. There are 15 data sources in all. |
| 2. Draft and published | Saving never changes what anyone else sees. A report reaches other people only after it is approved and published, and later edits stay in a draft until the next approval. |
| 3. Data scope | The server decides whose rows you may see: your own, your team, your department, your branch, or the whole company. Filters can narrow your scope, but never widen it. |
| 4. Masking | Personal fields (such as date of birth and ID numbers) and compensation fields (such as salary and bank account) show as Restricted to anyone without the matching WorkHarmony right. |
| 5. Actions | For each report, a publisher grants roles or people the actions discover, view, run, export, print, schedule, share and edit. Each action switches on a button in Report Studio. |
1.4 The rights you need
| To do this | You need |
|---|---|
| Run a report that has been published to you | A grant on that report, nothing else |
| Open Report Studio and browse | The Report Studio view right |
| Build reports in the wizard | The create right, plus the normal WorkHarmony right for the data (for example Daily attendance view) |
| Use the Advanced designer | The design right |
| Approve and publish | The approve and publish rights |
1.5 Finding Report Studio
- In the main menu, scroll down to the Insight group.
- Click Report Studio.
Reports that are published to you also appear inside the module they belong to, under a Reports heading. For example, a Staff directory report placed in People sits under People › Reports and opens straight into the report viewer.
Every Report Studio page has its own navigation rail on the left, titled Analytics engine. You only see the entries your rights allow:
- Home and Report library are where you start.
- Create report and Templates are for building.
- Schedules, Publishing, Permissions and Administration are for delivery and governance.
- My exports holds the files you download.
1.6 Report Studio Home
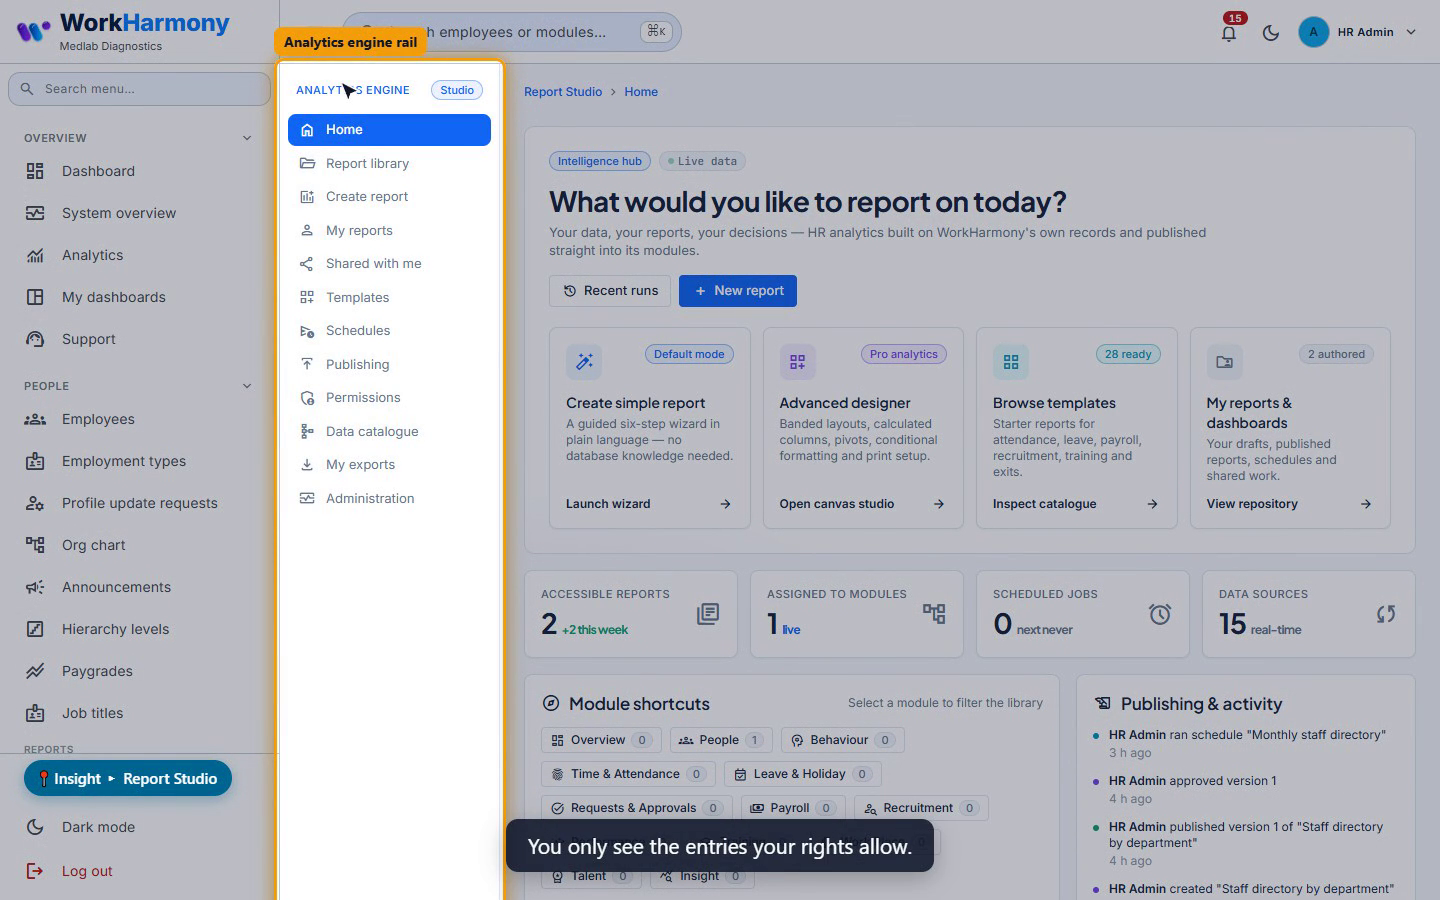
- At the top, Recent runs opens the library, and New report starts a new report.
- Four cards take you straight to the Simple wizard, the Advanced designer, the template gallery, and your own reports.
- Tiles show how many reports you can reach, how many are placed in module menus, your scheduled jobs, and how many data sources you may build on.
- Module shortcuts open the library filtered to one module, and show how many reports are placed in each.
- The Recent list shows your six most recently run or changed reports. Click Run to open one in the viewer.
- On the right, Publishing & activity lists the latest events, and Studio status counts reports awaiting review, your reports, and templates.
1.7 The Report library
Click Report library in the rail. The library lists every report you are allowed to discover.
- The search box filters as you type. It matches the report name, its code, the description and its tags.
- The module list shows the reports placed in one module.
- The status tabs filter by draft, in review, published or archived. Active, the default, shows everything except archived reports.
- You can also filter by sensitivity (standard, personal data or compensation), and sort by recently changed, last run, most run, or name.
Each card shows the report's name and code, its status, where it is placed, its owner, and when it last ran. Click Run to open it, or the copy icon to duplicate it into your own draft.
Switch to Table to see more at once: the placement, category and tags, which roles have access, the status, and the last run. Tick reports here to archive several at once.
My reports lists only the reports you own, and Shared with me lists the reports a colleague has shared with you personally.
2. Creating a report and using templates
2.1 Three ways to start
- Open Report Studio.
- On Home, click New report (or use Create report in the rail).
- Choose how you would like to start.
| Option | What it does | Right needed |
|---|---|---|
| Simple mode (recommended) | Opens the six-step Simple wizard (chapter 3). | Report Studio create |
| Advanced designer | Pick a data source and type a report name. Continue creates a draft with up to six recommended fields and opens the designer (chapter 8). | Report Studio design |
| From a template | Opens the Template gallery. |
Tip: All three routes produce the same kind of report, so you can begin in the wizard and refine the report in the designer later.
2.2 The Template gallery
The Template gallery holds 28 ready-made reports on WorkHarmony's own data. You only see the templates whose data source you are allowed to read.
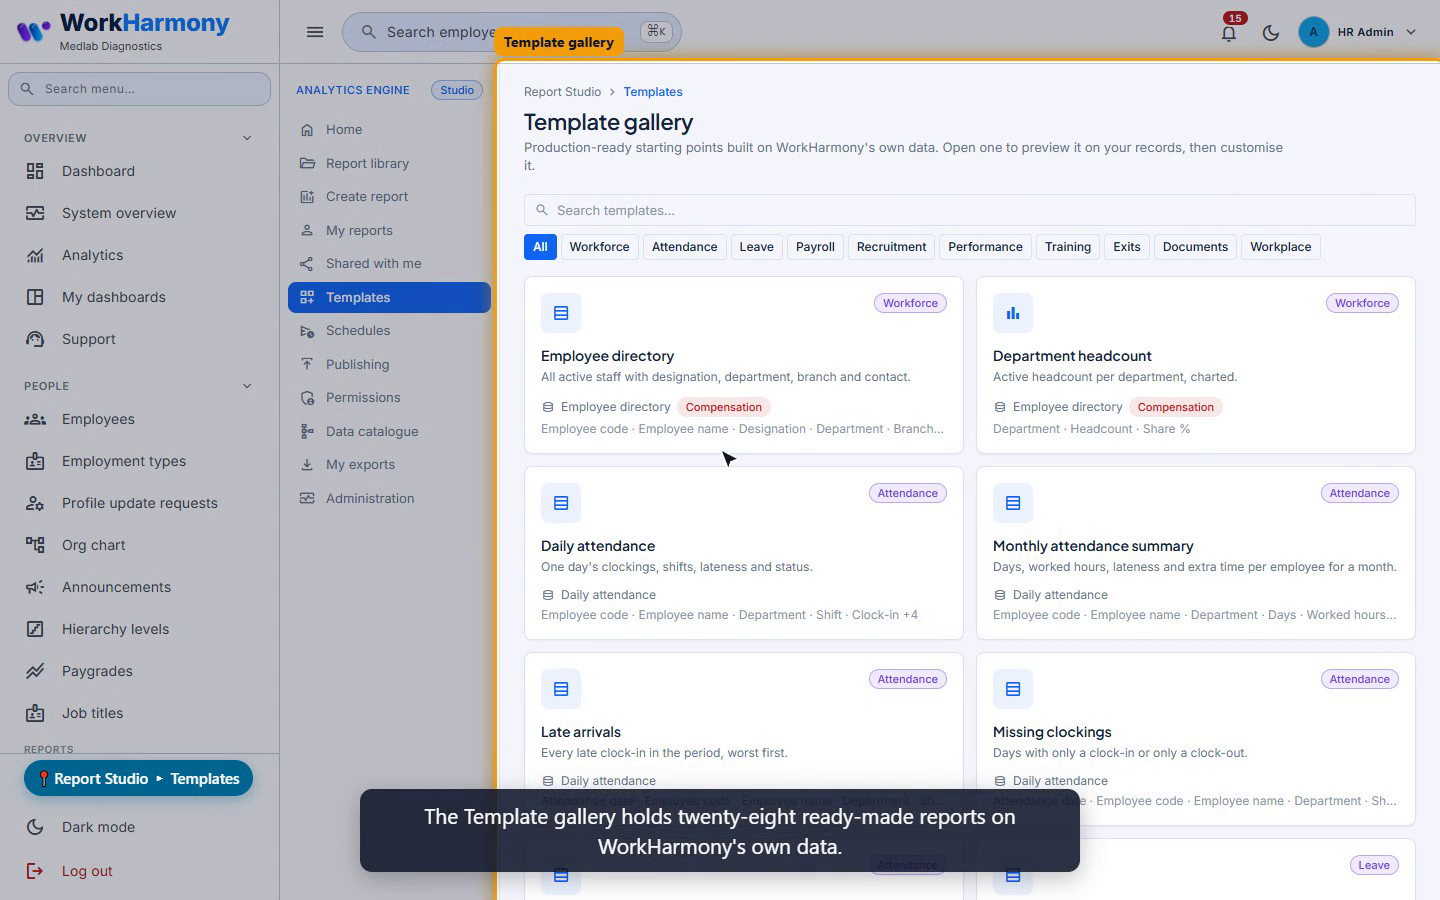
- The search box matches the template name, its description, and its data source.
- The category buttons narrow the gallery to workforce, attendance, leave, payroll, recruitment, performance, training, exits, documents, or workplace.
- Each card shows the layout, the category, the data source and its sensitivity, and the first few columns. A Custom chip marks a template your own company saved, and Printable marks a one-page-per-record layout.
2.3 Template details and making your copy
Click a card to open its details. The live preview runs the template on your own data, within your own access. On the left, the summary shows the data source, presentation, category and page size, followed by the columns and the parameters that people fill in when they run the report.
- In Name for your copy, type the name your new report will get.
- Optionally tick Use sample data to swap real values for placeholders. This is handy for checking a layout, or when you should not read real records.
- Click Customise in wizard to create a draft copy under your name and open it at step 3 of the Simple wizard, or Open in designer to create a draft copy and open it in the Advanced designer.
Note: The template itself never changes. You always work on your own draft copy.
2.4 Printable templates
Printable templates, such as the payslip, the salary certificate and the employee ID card, print one page per record. Publish them at the own records only scope, so each person prints only their own document.
3. The Simple wizard
The Simple wizard builds a complete report without any database knowledge. This chapter follows one example: a headcount by department, shown as a chart.
3.1 Opening the wizard
Click Launch wizard on the Create simple report card on Home, or choose Simple mode under Create report.
The stepper across the top shows the six steps: choose module, report goal, select fields, filters and scope, choose layout, and preview and save. Completed steps get a green tick, and you can click back to any earlier step.
The footer always shows Back, the save status, Save draft (from step 3 onwards), and Continue, which is enabled once the current step is complete.
3.2 Step 1: Choose module
Choose the module your report is about. Only modules whose data you may read are shown. In the example, click People, then choose the data source Employee directory. Each data source says what one row is, and how many fields it has.
3.3 Step 2: Report goal
Say what you want to know. Pick a suggested question, start from one of the templates for this data source, or choose Blank custom report.
Important: A suggested question fills in the columns, filters and sorting for you, but it also adds a This month period on the main date. On the employee directory that is the joining date, so you may need to change it in step 4.
In the example, choose Blank custom report, which starts with the recommended fields, and click Continue.
3.4 Step 3: Select fields
Tick the fields you want. Search by name, or use the group buttons. Badges tell you which fields are recommended, which hold personal or compensation data, and which will be masked for you.
In the example, add Headcount from the Measures group; it counts one per employee. The Selected columns panel lists your columns in order. Drag the grip, or use the arrows, to reorder them, and the cross to remove one.
3.5 Step 4: Filters and scope
The counters show the rows in the data source, the rows matching your filters, and your security scope. You can narrow your scope here, but never widen it.
- Date range works on the main date. All time removes the period. The other buttons set a period that viewers can change when they run the report.
- Quick filters offer the values found within your scope. In the example, click Active under Employment status to keep current staff only.
- More conditions lets you add any other condition: choose a field, a condition (such as is any of or between), and then a value.
- Grouping and totals turn the report into a summary. In the example, group by Department and tick Show a grand total row. Number columns become sums, and the other columns are left out.
- Sorting sets the order. In the example, sort by the headcount, descending, so the largest departments come first.
3.6 Step 5: Choose layout
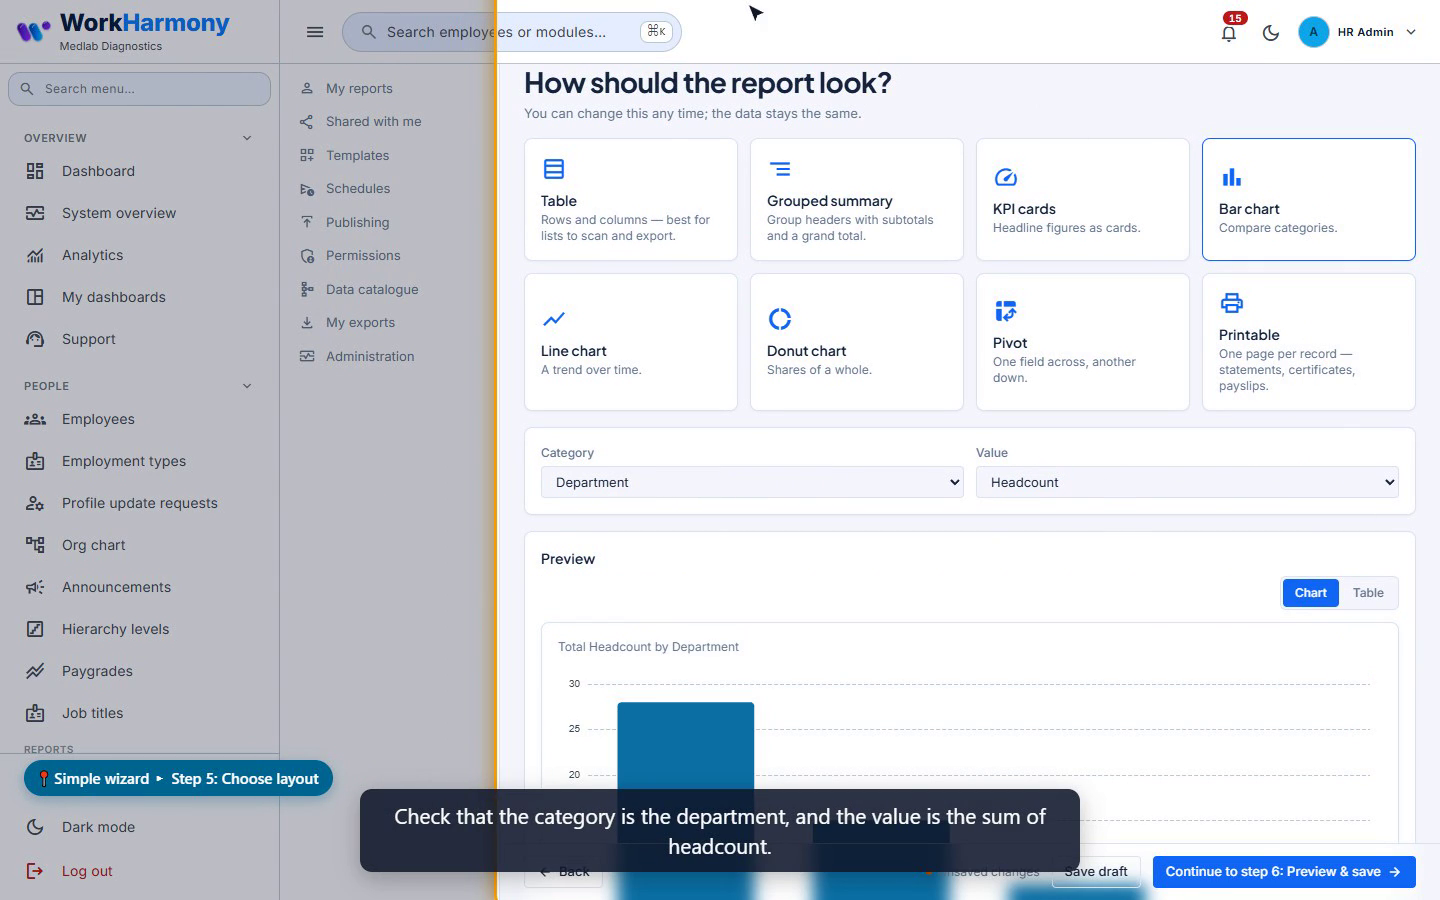
Choose how the report looks: a table, a grouped summary, KPI cards, a bar, line or donut chart, a pivot, or a printable page per record. You can change this at any time, and the data stays the same.
In the example, choose Bar chart. Check that the category is the department and the value is the sum of headcount. The preview updates straight away. Try the Donut chart to show each department's share of the whole.
3.7 Step 6: Preview and save
The preview runs on real data, within your scope. Tick Sample data if you only want to check the layout without reading real records.
- Give the report a name, a short description, and some tags to help people find it.
- Choose how to save:
- Save and open saves the report and shows what to do next.
- Save draft saves and stays in the wizard.
- Submit for publishing saves it and sends it for review.
From the next screen you can run the report, publish it to modules, refine it in the designer, or keep editing.
Note: Saving never changes what anyone else sees. A new report stays a draft until it is approved and published.
4. Running a report
Every published report opens in the same viewer, wherever you start from: the Report library, or a module menu such as People › Reports.
4.1 The title row and your scope
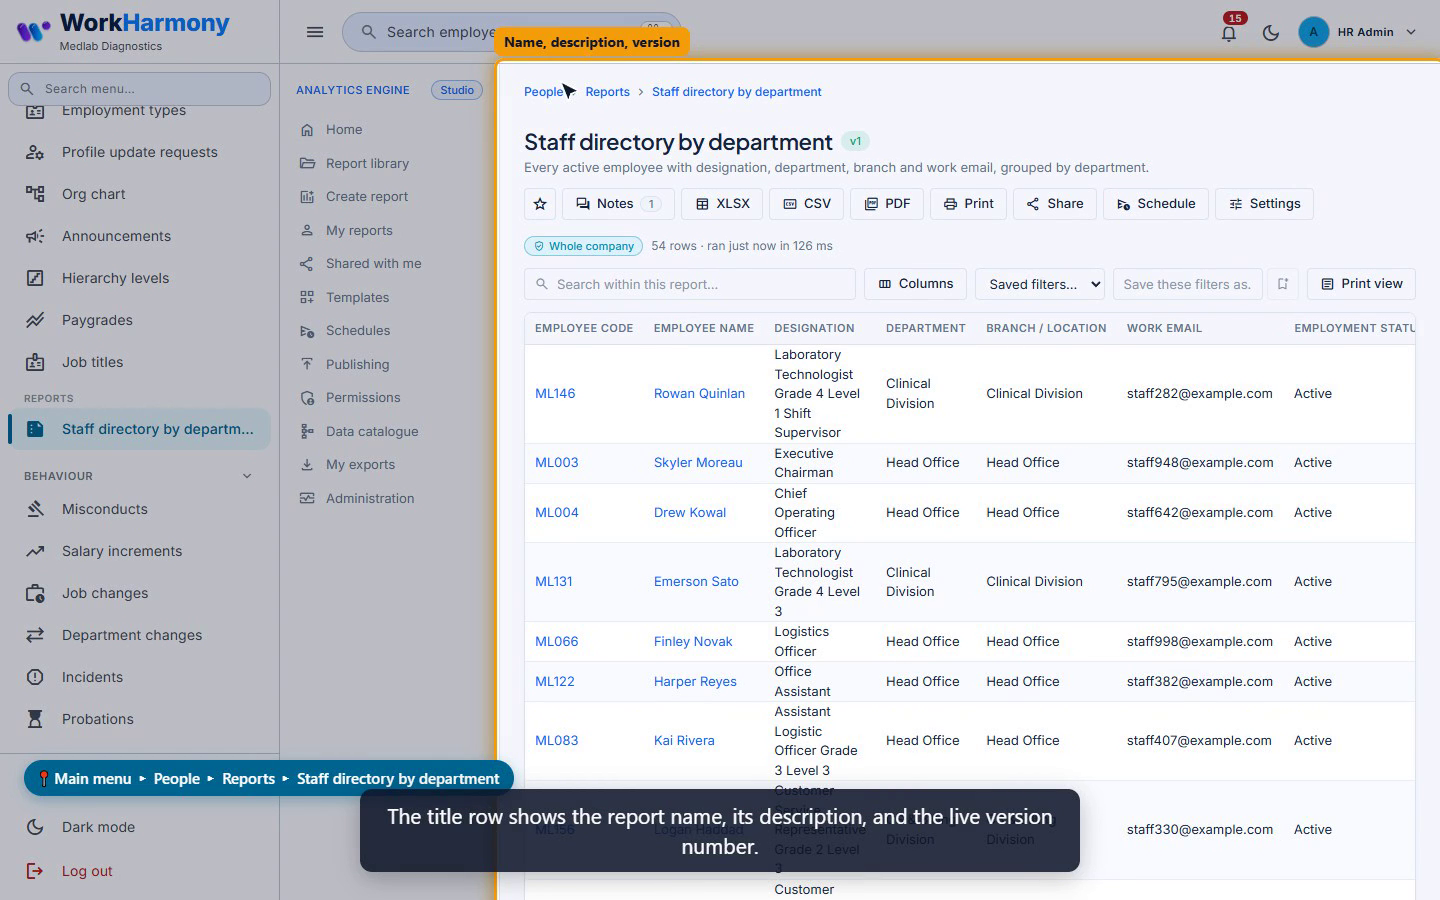
The title row shows the report name, its description, and the live version number. Next to it are the actions you are allowed to use: favourites, notes, XLSX, CSV and PDF exports, print, share, schedule, and settings. Buttons you have no right to use are simply not shown.
Under the title, the blue chip shows your data scope for this run, that is, whose rows the report may include. An amber chip appears when some fields are restricted for you, and the text beside it shows the number of rows and how long the run took.
4.2 Parameters
When the author adds parameters, such as a period or a department, they appear in a card above the table. Fill them in and press Apply. A red star marks a required parameter, and date ranges offer presets such as this month, last month, or the last 30 days.
4.3 Searching, sorting and choosing columns
- Search within this report searches the rows on the server as you type.
- Click a column heading to sort by it. Click it again to reverse the order.
- Columns lets you hide or show columns. Your exports use the same columns you choose here.
4.4 Saved filters
- Type a name in Save these filters as.
- Click the bookmark.
Saved filters are yours alone, and they appear in the Saved filters list the next time you open the report.
4.5 Links, restricted values and paging
- A blue, underlined value links to the record's own page, such as the employee profile, if you are allowed to open it.
- A lock with the word Restricted marks a value that is hidden from you.
- When there is more than one page, use the paging bar to move between pages, and choose 25, 50, 100 or 250 rows per page.
4.6 Drilling down
In grouped reports, charts and pivots you can drill down. Click a group value, a bar, or a pivot cell to see the rows behind it, and use the breadcrumb above the table to go back.
When the author defines a drill hierarchy (for example department, then designation, then employee), a Drill by button appears. Turn it on and walk down one level at a time. Every level stays within your scope, and exports taken while drilled contain only the drilled rows.
4.7 Notes and favourites
- Click Notes to open notes and discussion. Post a note for everyone who uses the report, or hover over a row and click the speech bubble to comment on that row. You can reply to a note, and resolve it once it has been dealt with.
- The star adds the report to your favourites.
4.8 When something goes wrong
| Message | Meaning |
|---|---|
| Report not found | You have no access to the report. |
| No records match | Your filters find nothing. |
| Narrow the date range | The report takes too long to run. Choose a shorter period. |
5. Exports, printing and My exports
5.1 What an export contains
The export buttons sit in the viewer's title row. An export contains every row that matches your parameters, search, drill and scope, not only the page on screen. It uses the columns you have visible, in your current sort order.
5.2 Excel, CSV and PDF
| Button | What you get |
|---|---|
| XLSX | An Excel file with real numbers, a title, a line showing who generated it and with what scope, a frozen header row, totals, and the author's colour rules. |
| CSV | Plain data with a header row. It is saved so that Excel shows Dhivehi text correctly, and cells are protected from running as formulas. |
| Matches the print layout: the paper size, margins, watermark, signatures, QR code, and right-to-left text. You need the export or the print action, and a PDF can hold up to 5,000 rows. |
5.3 Small and large exports
Small exports, up to 5,000 rows, are built straight away and download automatically. Larger ones are prepared in the background, with a progress chip and a Cancel link, and you collect them later from My exports. Excel and CSV files can hold up to 100,000 rows.
5.4 Print view and printing
Print view turns the screen into paper pages, built from the report's page setup. Each page has the company header, the parameters, the report code, the generation time and your scope, and the footer shows the page numbers.
Print opens your browser's print dialog at exactly that paper size.
Tip: Print uses the rows loaded on screen. For a long report, set 250 rows per page first, or use the PDF export instead.
5.5 My exports
My exports, in the rail, lists the files you exported and the files that schedules delivered to you. Each row shows the report, the format and file size, the status, the rows written, and when the file was created and when it expires.
- Click Download when a file is ready.
- A failed export of your own can be retried, and a queued or running one can be cancelled.
- Files that a schedule delivered carry a Scheduled chip.
Note: Export files are kept for 72 hours.
6. Schedules and automated delivery
6.1 How schedules work
A schedule produces a report file on a timetable and delivers it to people and roles. At every run, WorkHarmony works out the recipients again, checks each person's access, and builds each file under that person's own scope. So a supervisor never receives another team's data.
6.2 A quick schedule from the viewer
The quickest way is Schedule in the viewer's title row, which sends the report to you alone. It needs the schedule action on the report.
- Press Apply on the report first: your current parameter values are saved with the schedule.
- Click Schedule.
- Choose a frequency: daily, weekly on Mondays, or monthly on the first.
- Choose a time and a format: PDF, Excel or CSV.
6.3 Creating a schedule for other recipients
For more control, and for other recipients, use the report's settings. You need the Report Studio schedule right, and the report must be published.
- Open the report's Settings, choose the Schedules tab, and click New schedule.
- Give the schedule a name, and pick the frequency: hourly, daily, weekly or monthly. For a weekly schedule, choose the days of the week; for a monthly one, choose the day of the month.
- Set the time, the timezone, and the format. A PDF can hold up to 5,000 rows, and Excel or CSV up to 100,000.
- Choose the delivery. It is in-app by default. Tick Email link to also send an e-mail with a link.
- Add recipient roles, whose members are worked out again at every run, and named people.
- Click Save schedule.
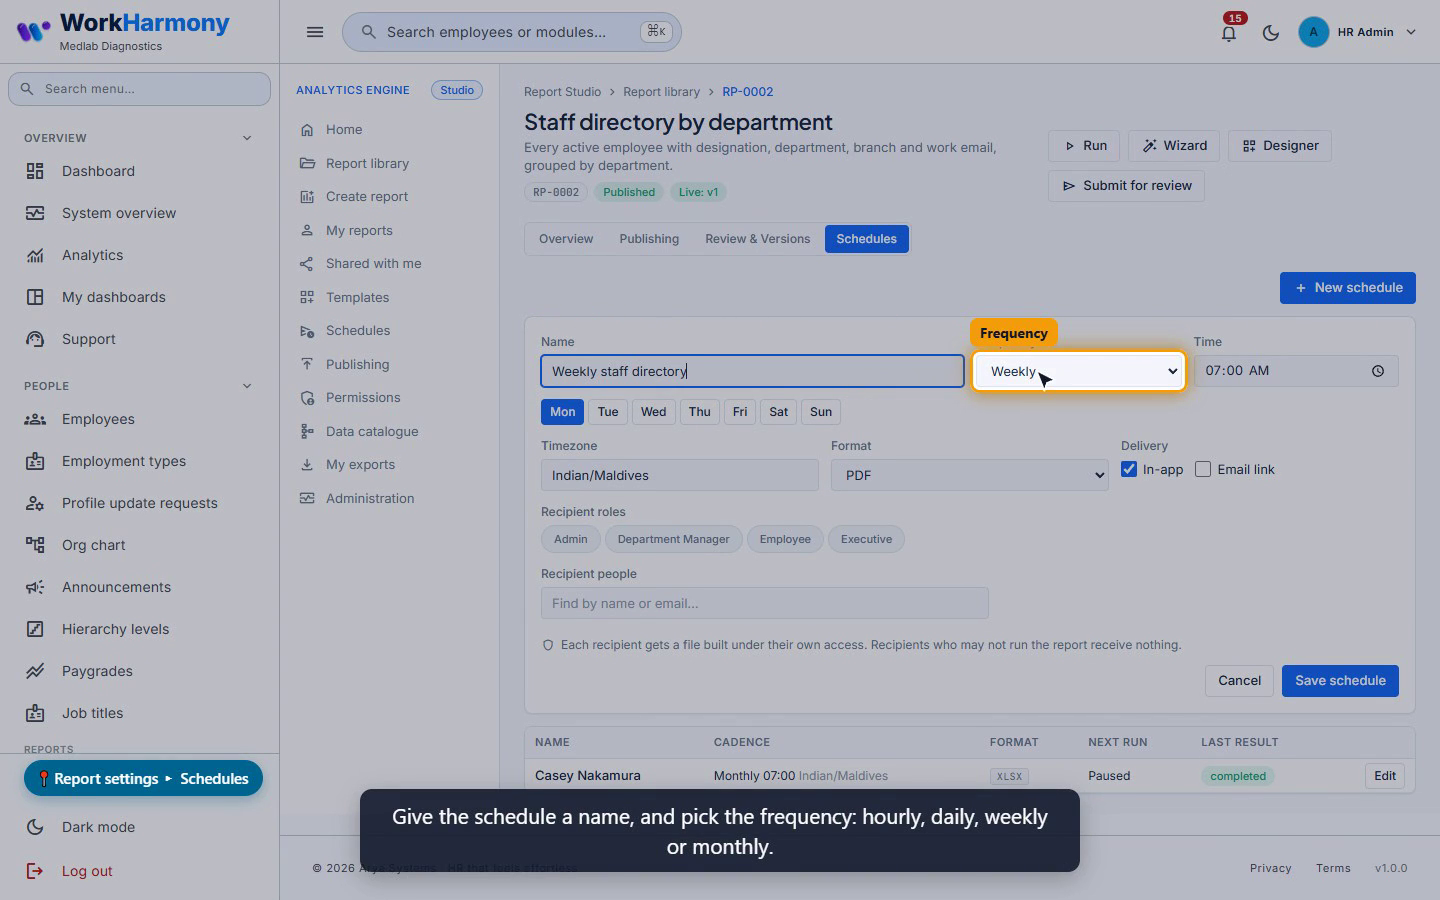
Important: The owner is not added automatically, so add yourself if you want a copy. Recipients who may not run and export the report receive nothing. The file itself is never attached to an e-mail, and downloading it always needs a sign-in.
6.4 The Schedules page
The Schedules page lists your schedules, and the schedules on reports you manage. The Active, Paused and Failing cards filter the list.
Each row shows the cadence and timezone, the format, the recipients and channels, the next run, and the status of the last run. The icons let you run a schedule now, pause or resume it, see its delivery history, edit it, or delete it.
6.5 Delivery history and failures
Delivery history shows when each file was produced, its status, the rows, the recipients, and the reason for any failure.
After five failed runs in a row (for example when the report was unpublished), a schedule pauses itself. Fix the cause, and click Resume.
Note: Archiving a report pauses its schedules, but unpublishing does not, so pause them yourself.
7. Sharing a report
7.1 Sharing with a colleague
Share gives one colleague access to a published report, but never wider than your own access. The Share button appears in the viewer when you hold the share action on the report.
- In the viewer, click Share.
- Type at least two letters of a person's name or e-mail address, and pick them from the list. You cannot pick yourself.
- In They see, set the person's data scope: their own records, their direct reports, their team, their department, their branch, or the whole company. Only scopes up to your own are offered, and their rows are always worked out from their own employee record.
- Tick May export to let them download Excel and CSV files. It only appears if you are allowed to export yourself.
- Click Share.
The report appears in their Shared with me list, and in any module menu it is placed in. Your shares are listed under Shared with, each with a Remove button to withdraw it.
7.2 What the colleague can do
- They can find, view, run and print the report, including PDF.
- They can export to Excel and CSV only if you ticked May export.
- They can never schedule it, share it again, or edit it.
- Fields hidden from you stay hidden from them.
7.3 When a share is refused
The message tells you why: the report must be published first, you cannot share wider access than you have, or the person already has access.
8. The Advanced designer
The Advanced designer is the canvas for reports that must look exactly right on paper, and for everything the wizard does not offer: formulas, colour rules, parameters, pivots and more.
8.1 Opening the designer
Open the designer from a report's settings page with the Designer button. You can also choose Advanced designer under Create report, or Open in designer on a template. It needs the Report Studio design right.
8.2 The designer layout
The designer has five parts: the top bar, the left panel, the canvas in the middle, the inspector on the right, and a status bar along the bottom.
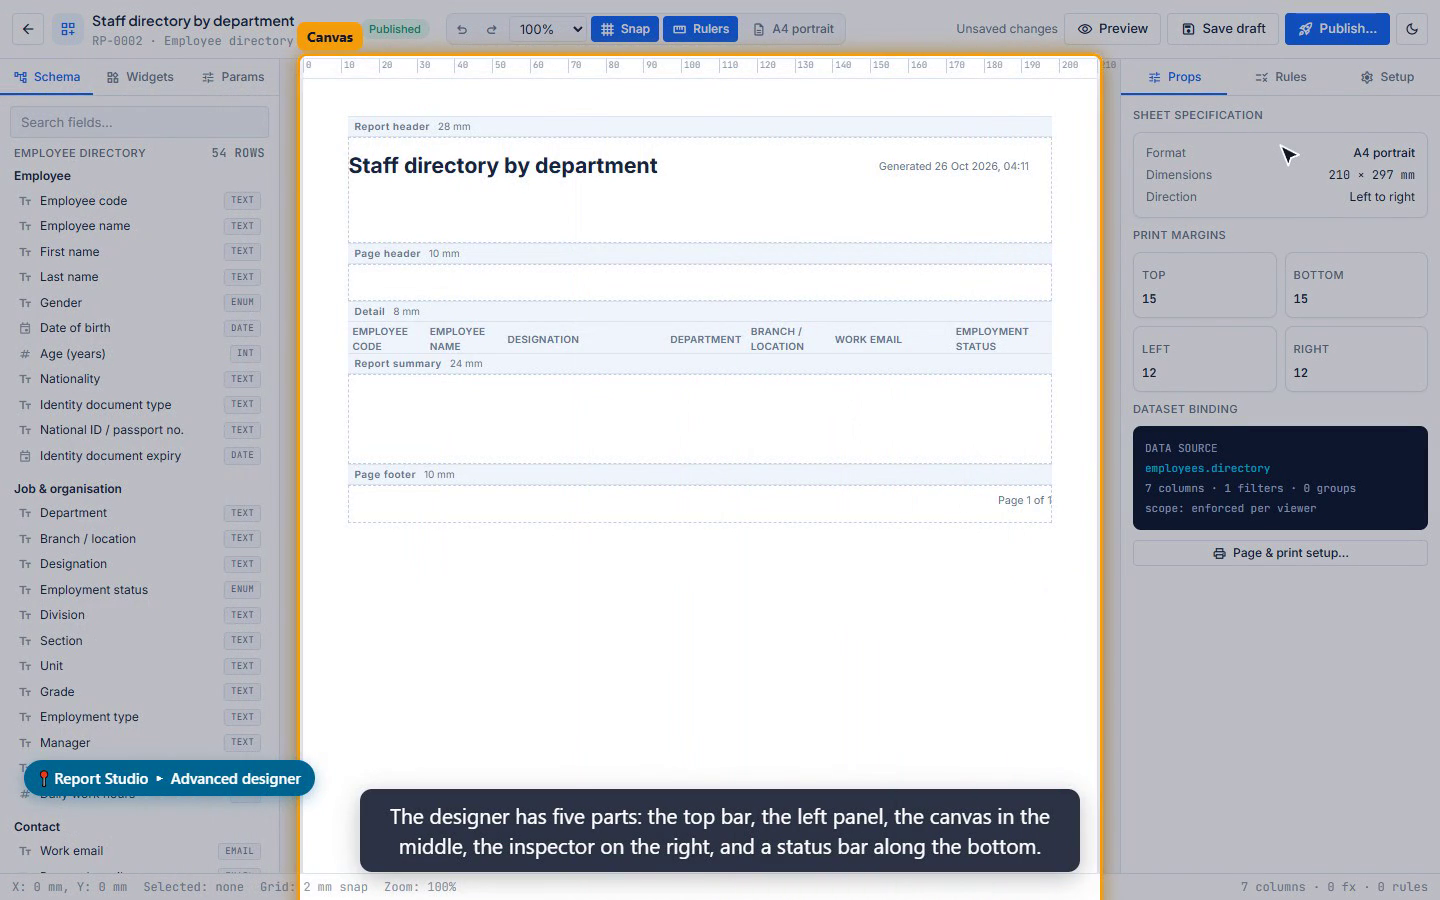
The top bar holds undo and redo, zoom, snap to a 2 mm grid, rulers, the page size, Preview, Save draft and Publish. Ctrl+S saves at any time, and F5 switches between design and preview.
8.3 The left panel: Schema and Widgets
- The Schema tab lists every field of the data source. Click a field to add it as a column, or drag it onto a band to place it on the page. Calculated measures and relationships are listed below the fields.
- The Widgets tab holds 14 elements to drag onto the page: text, data field, table, chart, KPI, logo or image, shape, line, QR code, barcode, signature, generated date, page number, and subreport.
- Below the widgets you can add bands, and save or insert reusable components, such as a corporate header that other authors can reuse.
8.4 The canvas and bands
The canvas is the real page, divided into bands: report header, page header, group headers, detail, group footers, report summary, and page footer. Each band's strip shows its name and height. Hover over it to move, resize, or remove the band.
8.5 Working with elements and columns
- Click an element to select it, drag it to move it, and drag its corner to resize it.
- The arrow keys nudge it by 1 mm, or by 5 mm with Shift.
- The Props tab shows its position, size and text style.
- Click a table heading to edit that column: its heading, its summary, format, decimals, alignment and width, and whether it is visible by default.
8.6 The Setup tab
The Setup tab gathers the report settings: grouping and sorting, parameters, chart, pivot and matrix, subreports, relationships, and export and print setup, plus switches for grand totals and drill-down.
- Grouping and sorting sets up to five grouping levels, a grand total row, a page break for each group, sorting, a row limit, and the drill hierarchy that viewers can walk level by level.
- Parameters are the questions people answer when they run the report. Add one, bind it to a field, and choose its type, a default (such as this month), and whether it is required.
- Chart, pivot and matrix sets how the result is presented: a table, a bar, line or donut chart, KPI cards, a pivot, or a matrix.
- Export and print setup controls the paper, orientation, text direction, margins, the header and footer text, a watermark, a verification QR code, signature blocks, and one page per record, for payslips and certificates.
8.7 Colour rules and calculated fields
On the Rules tab, conditional formatting colours a cell when a condition is met, for example late minutes greater than 30 in bold red. The first matching rule for a cell wins.
Calculated fields add a column from a formula:
- Click New fx.
- Give it a name and choose the result type.
- Type the formula using the report's column keys. The formula is checked as you type.
Forty functions are available, from IF and ROUND to DATEDIFF, FORMAT DATE and CURRENCY WORDS, which writes an amount in words.
8.8 Preview, save and publish
- Preview runs the report on your real data, within your access, and runs again a moment after every change. Tick Sample data to design without reading real records.
- Save draft saves your changes. The server checks them and lists any problem in a red banner.
- Publish saves, and takes you to the publishing settings (chapter 9).
Note: Nothing goes live until the draft is approved and published.
9. Publishing, approval and access
9.1 Three decisions before a report goes live
A report reaches other people only after three decisions:
- An approver approves a version.
- A publisher places it in a menu and grants roles or people access.
- The version is published.
Until then, only its authors and report managers can see it.
9.2 The report's settings page
Open the report's settings page from the library. The header shows the report code, its status, and only the actions that apply right now. The Overview tab shows the definition, and the Actions card: duplicate, save as template, unpublish, archive, restore, and delete.
9.3 Submitting for review
- When the draft is ready, click Submit for review.
- Add notes for the reviewer, and confirm.
The status changes to Pending review.
9.4 Placement and access
On the Publishing tab, choose where the report appears and who may use it.
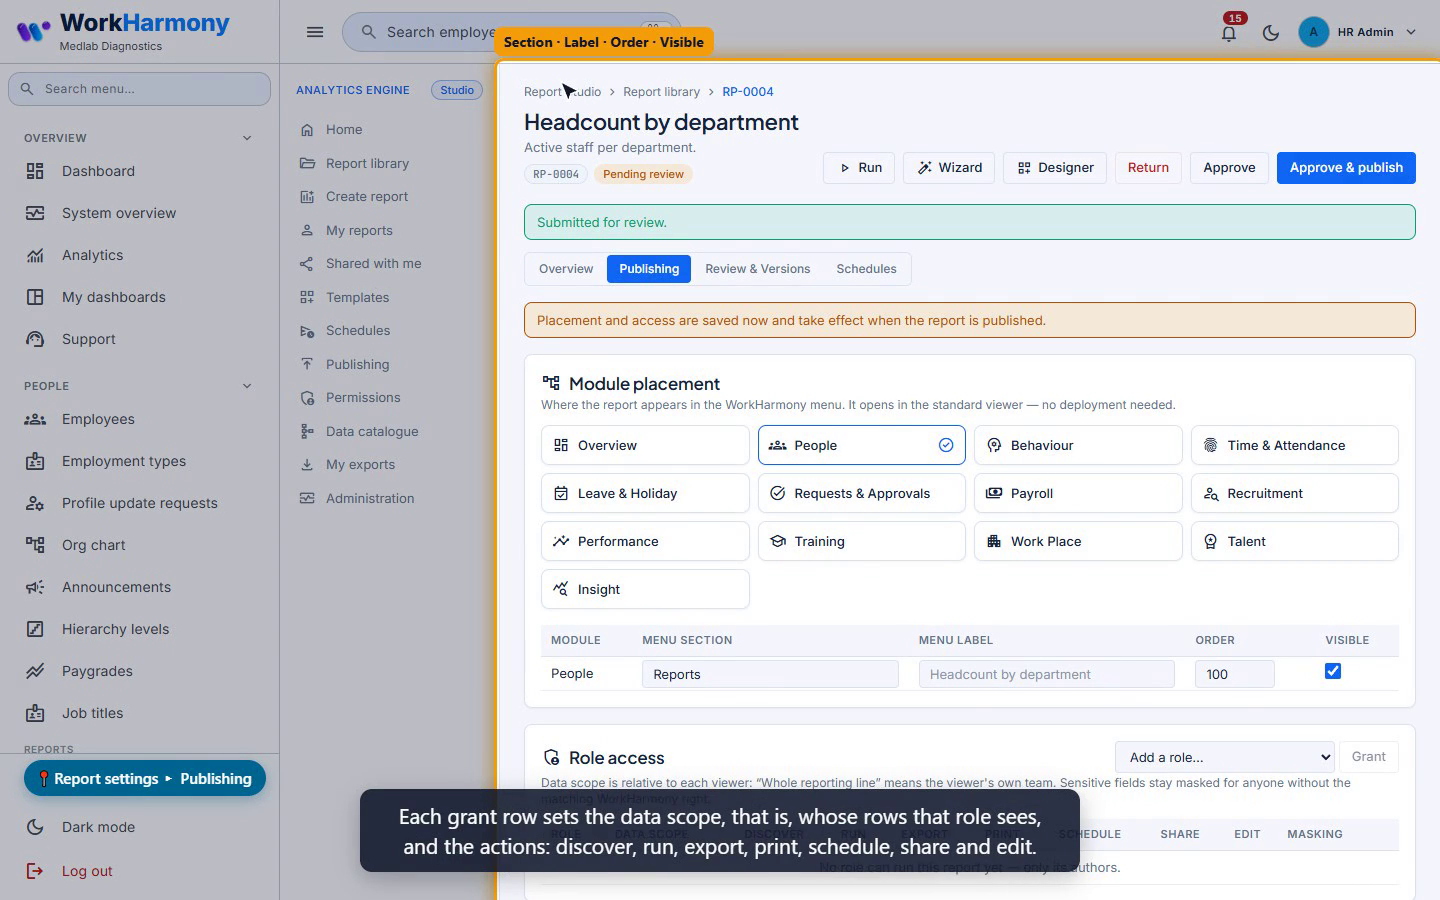
- Under Module placement, click a module tile, such as People, to place the report in that menu group. Each placement has a menu section (normally Reports), a label, an order, and a Visible switch.
- Under Role access, choose a role and click Grant. Each grant row sets the data scope (whose rows that role sees) and the actions: discover, run, export, print, schedule, share and edit. Mask fields hides extra fields for that role.
- Under Individual exceptions, grant access to one named person if needed. Shares made from the viewer appear here too.
- Click Save placement and access.
While the report is not live, a banner reminds you that these settings take effect when it is published.
9.5 Approving and publishing
An approver reviews the draft and chooses:
- Approve records a frozen version.
- Approve & publish records the version and makes it live in one step.
- Return sends the draft back to its author, with a reason.
After their next page load, everyone who was granted the report finds it in the module menu, under Reports.
9.6 Preview as role
Preview as role checks what a role will see, without running the report: whether the report is visible, where it is placed, the effective scope and actions, and any masked fields.
9.7 Review and versions
Review & versions lists every approved version, with its notes, the approver, and which one is live. Make live on an earlier version rolls back instantly, and Restore to draft copies an old version into the draft.
Important: People always run the published version. Edits stay in the draft, shown as unpublished changes, until the next version is approved and published. For four-eyes control, give authors and approvers different roles.
10. Governance screens
Report Studio has four governance screens: Publishing, Permissions, Administration and the Data catalogue. None of them ever shows report figures.
10.1 Publishing
The Publishing screen is the review queue.
- Awaiting review lists every submitted report you may approve, with its author and when it was submitted. Review opens the report's review tab.
- Module assignments shows, for each menu group, the published reports placed there and their menu section. Published reports with no placement are listed separately, because they can only be reached from the library.
10.2 Permissions and access governance
This screen is a read-only matrix of reports against roles:
| Entry | Meaning |
|---|---|
| Full | Run and export |
| Run | View and print |
| Discover only | Listed but not runnable |
| * (asterisk) | Extra fields are masked |
Simulate access shows in one line what a role would see in a report: the scope, where it appears, and the masked fields. To change a grant, click the report name to open its Publishing tab.
10.3 Administration
Administration shows usage and failures.
- Monitoring shows the runs, failures, average and slowest durations, exports and schedules, runs per day, and the most-run reports, for the last 7, 30 or 90 days.
- Executions lists the most recent runs: when, which report, who, the context, the scope, the status with any error code, the rows, and the duration. You can filter by completed, failed or running.
- The Audit trail is an append-only record of every change, run, export and download. Filter by event, search the descriptions, and click the braces to see the details, such as the format, rows and scope of an export.
10.4 Data catalogue
The Data catalogue describes every data source you may build on. Pick one to see what one row is, the right it needs, your own scope, and its approved relationships.
The fields table lists every field with its group, type and sensitivity, and whether it can be filtered, grouped, sorted or drilled. Use Filter fields to find one quickly.
Data sources you do not have the right for are listed under Not available to you, together with the right you would need to ask for.
11. Configuration for administrators
11.1 Three levels of configuration
- Roles and permissions decide who may author, approve and publish.
- Server settings set every limit, the same for every company.
- Per-report settings are set by publishers on each report's Publishing tab.
Note: There are no Report Studio settings in Administration › Configurations.
11.2 Report Studio rights
Assign Report Studio rights to roles under Security › Roles.
| Right | What it allows |
|---|---|
| View | Opens the studio |
| Create | Builds reports in the wizard |
| Design | Opens the Advanced designer |
| Edit | Saves and submits drafts |
| Delete | Removes reports |
| Approve | Reviews drafts |
| Publish | Places reports in menus and grants access |
| Export, Schedule | Files and deliveries as an author |
| Manage | Works on any report and opens monitoring |
| Audit | Opens the audit trail |
Only the Admin role holds all of these at first.
Three rules sit on top of these rights:
- Authors also need the normal WorkHarmony right for the data, such as Daily attendance view.
- People who only run published reports need no studio rights at all, just a grant.
- The company's plan must include Report Studio.
Important: WorkHarmony does not stop a person who holds both edit and approve from approving their own draft. If your policy needs four eyes, give authors and approvers different roles.
11.3 Server limits
Your system administrator sets the server limits in the API server's environment. The most important are:
| Limit | Value |
|---|---|
| Query time limit | 15 seconds |
| Runs per person | 60 per minute |
| Rows in an Excel or CSV export | 100,000 |
| Rows in a PDF | 5,000 |
| Background exports | Above 5,000 rows |
| Export expiry | 72 hours |
Raising the query time limit lets heavy reports finish, but slow queries hold the shared database for longer. Lower it, and more reports fail. Watch the failures in Administration after any change.
Important: Keep the result cache switched off. A shared cache store without the tenancy cache component would leak permissions between companies, not just report figures.
11.4 PDF output and the database
PDF files are printed with headless Chrome, from the same layout as Print view. That needs the Chrome PDF setting on, the PHP sockets extension, the renderer bundle, and a Chrome binary. Otherwise PDF files quietly fall back to a simpler layout.
Report queries run on a read-only database session. For defence in depth, add a database user that may only select, with rights on every company database, including companies added later.
11.5 Production checklist
- The scheduler runs every minute.
- A queue worker is running for large exports.
- Chrome and the renderer are installed for PDF files.
- The tenant migrations and permissions are in place.
- There is disk space for export files, which are not removed automatically.
11.6 Company data
Every data scope is worked out from the viewer's own employee record. Link every login to an employee, and keep departments, locations and managers up to date.
Videos
Introduction
Creating a Report and Using Templates
The Simple Wizard
Running a Report
Exports, Printing and My Exports
Schedules and Automated Delivery
Sharing a Report
The Advanced Designer
Publishing, Approval and Access
Governance Screens
Configuration for Administrators
Signed in to WorkHarmony? The same guide is in your workspace under Help.